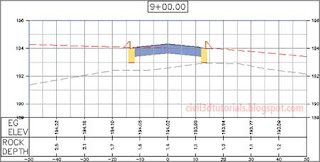
Additional Exercise;

In this exercise, you used styles to control the appearance of sections and section views. You learned about the difference between “regular” sections and corridor sections as well as the different ways in which they are stylized and annotated. You saw how to use group plot styles to arrange large numbers of section views into individual sheets. Finally, you used section view labels to provide even more detail to your section views.

In the following exercise, you will apply what you have learned about displaying and annotating sections and section views to the Madison Lane road design.

Open the drawing named Section Views Beyond.dwg located in the Chapter 11 class data folder. Use the following basic guidelines to change the display of the sections and section views contained within the section sheets.
  1. Assign the following styles to the section view group:
    1. Arrange the section views using the Bottom Up – Left To Right With Grid group plot style.
    2. Apply the Design 1V – No Grid section view style to all section views.
    3. Apply the _No Bands band set to all section views.
    4. Apply the label set named Rock to the rock sections.
    5. Apply the Presentation code set style to the Madison Lane corridor section.
  2. Update the group layout after you’ve made the preceding changes.
  3. Create section view labels for any section views that fall within the bus pull-off at station 3+00 (0+090). The labels should call out the offset and elevation of the right edge of pavement.

So far in this discuss, you have seen how to create many different types of annotations. There are label sets that are applied to sections, labels applied to corridor sections through code set styles, labels applied to the section views and bands, and even labels attached to objects that have been projected to the section views. One limitation of these labels is that they’re all connected to something and therefore get their information and location from another object.
What if you need to create a basic, all-purpose label that can be used to convey offset and elevation on a section view? To do this, you create a section view label.

Section view labels are attached to the section view itself. They can be placed anywhere within the section view and used to label just about anything.

To create section view labels, complete the following steps:
  1. Open the drawing named Creating Section View labels.dwg located in the Chapter 11 class data folder. The drawing is zoomed in to the first section view on Jordan Court where the road is widened to accommodate a turn lane. The scenario for this exercise is that you have been asked to include offset and elevation information for the curb flowline so that the contractor knows exactly where to place the curb in the widened area.
  2. On the Annotate tab of the ribbon, click Add Labels.
  3. In the Add Labels dialog box, do the following:
    1. For Feature, select Section View.
    2. For Label Type, select Offset Elevation.
    3. For Offset Elevation Label Style, verify that Offset Over Elevation is selected.
    4. For Marker Style, verify that Basic is selected.
    5. Click Add.
  4. Click one of the grid lines of the section view.
  5. Right-click while holding down the Shift key, and then select Endpoint. Click the flowline of the left curb.
    Tips:The flowline is located at the bottom of the vertical curb face. This is where the flow of water is concentrated during a rainfall event.
  6. Press Esc to clear the current command. Click the newly created label, and drag its square grip up and to the left to improve its readability.
  7. Click the label, and then click Edit Label Text on the ribbon. This opens the Text Component Editor dialog box.
  8. In the window on the right, click just to the left of the word Offset to place your cursor in the position just before it. Type CURB FLOWLINE, and press Enter. The result should look like Figure 11.11.
    Adding text to a label using the Text Component Editor
    Figure 11.11  Adding text to a label using the Text Component Editor.
  9. Click OK to dismiss the Text Component Editor dialog box. The label now includes the identification of the point to go along with the offset and elevation (see Figure 11.12). This is the code that you will use.
    A label has been added that indicates the offset and elevation
    Figure 11.12  A label has been added that indicates the offset and elevation of the curb flowline.

Be Careful

Although this label is pointing to the curb, it is not attached to it. If a change in the design causes the curb to move, the label might not be pointing to the right spot and will need to be updated manually. This is not a difficult thing to do, but it’s something that could easily be overlooked. A more permanent solution would be to incorporate the label into a code set style.

Throughout this discuss, you have been working with several sheets worth of section views all neatly arranged within predefined sheet borders. You may be wondering what controls this behavior, and if you guessed that it’s some sort of style, you are correct. The arrangement of multiple section views is accomplished by a group plot style.

A group plot style uses an assortment of settings to configure the layout of multiple section views. When section view groups are created, there are two placement options: Production and Draft. When a section view group is created using the Production placement option, the layout of section views is made to fit within individual sheets. The size and shape of the individual sheets comes from a template (.dwt) file. When the Draft placement option is used, the section views are laid out as a single group and are not bound within a given area.

Another function of group plot styles is to overlay a grid on the sections. With this approach to sheet creation, the section views do not typically have their own grid but are superimposed on a grid that covers the entire sheet.

To use group plot styles to change the arrangement of multiple section views, follow these steps:
  1. Open the drawing named Applying Group Plot Styles.dwg located in the Chapter 11 class data folder.
  2. Click one of the section views displayed within the three sheets, and then click View Group Properties on the ribbon. The Section View Group Properties dialog box opens.
  3. On the Section Views tab, click on the first row within the Group Plot Style column (see Figure 11.9). This is the code that you will use.
    Where to click to change the group plot style
    Figure 11.9  Where to click to change the group plot style for the section view group.
  4. Select Left To Right – Top Down and click OK.
  5. Click OK to dismiss the Section View Group Properties dialog box. Notice that the section views shift toward the top left of the sheet and that they are arranged with the stations increasing from left to right.
  6. Click one of the section views, and click View Group Properties once again. This time do the following:
    1. Click the top row in the Group Plot Style column, and select Bottom Up – Left To Right With Grid.
    2. Click the top row in the Style column, and select Design 1V – No Grid.
    3. Click the ellipsis in the Change Band Set column.
    4. Select the Section Data band listed in the Section View Group Bands dialog box, and then click the red X to remove it. Click OK.
    5. Click OK to close the Section View Group Properties dialog box.
  7. Zoom in and study the newly configured sheets. With this configuration, the section views are superimposed on a grid provided by the sheets. Since the grid is already there, the section view styles do not show the individual grids. These styles also have their own offset labels across the bottom, so the section view bands were also removed.
  8. Click one of the section views, and then click Update Group Layout on the ribbon. With the newly applied section view styles and group plot style, the section views can now all fit on two sheets (see Figure 11.10). This is the code that you will use.
    A section view group with a new group plot style applied
    Figure 11.10  A section view group with a new group plot style applied.

You may need to display additional information about the sections to accompany what is conveyed by the section view. Bands can be a useful tool for this purpose, enabling you to display information both graphically and textually. There are two types of section view bands, as described here:
Section Data Bands
You use this type of band for labeling offset and elevation data at regular increments along the profile view.
Section Segment Bands
You use this type of band to label length and slope information about the individual segments. Since the individual labels are created segment by segment, they are not evenly spaced across the band as you see in a section data band. Weeding can be applied to improve situations where segments are short and labels overlap.
To apply section view bands to section views, follow these steps:
  1. Open the drawing named Applying Section View Bands.dwg located in the Chapter 11 class data folder.
  2. Click the grid of the bottom section view, and select Section View Properties on the ribbon.
  3. On the Bands tab of the Section View Properties dialog box, do the following:
    1. For Band Type, verify that Major Stations is selected.
    2. Under Select Band Style, verify that Parallel With Tick is selected.
    3. Click Add.
    4. Change the Gap value for the newly added band to 0.
    5. Scroll right and select EG in the Section1 column.
    6. Click OK.
  4. The band is added, but there are values with lines through them at either end of the band. With the section view still selected, click Section View Properties on the ribbon once again.
  5. On the Bands tab of the Section View Properties dialog box, uncheck the boxes in the Label Start Offset and Label End Offset columns. Click OK. The labels at either end of the band are now omitted.
  6. Add a band showing the depth of the rock surface beneath the existing ground surface by applying these settings:
    • Type: Section Data
    • Style: Rock Depth
    • Gap: 0
    • Label Start Offset: Unchecked
    • Label End Offset: Unchecked
    • Section1: EG
    • Section2: Rock
  7. Add a band showing offset values by applying these settings:
    • Type: Section Data
    • Style: Design – Offsets
    • Gap: 0
    • Label Start Offset: Checked
    • Label End Offset: Checked
  8. Access the Bands tab of the Section View Properties dialog box once again. Click Save As Band Set.
  9. Enter Sta-Elev-Rock Depth in the Name field and click OK. Click OK to close the Section View Properties dialog box.
  10. Press Esc to clear the previous selection. Click the section view to the north, and then click Section View Properties on the ribbon.
  11. On the Bands tab of the Section View Properties dialog box, click Import Band Set. Select Sta-Elev-Rock Depth and click OK.
  12. Select EG for Section1 of the first two bands. Select Rock as Section2 of the second band. Click OK. The bands for this section view now match the bands of the section view that you modified in steps 2 through 7 (see Figure 11.7). This is the code that you will use.
    A section view with bands added for existing
    Figure 11.7  A section view with bands added for existing ground elevations, rock depth, and offsets.
  13. Repeat steps 10 through 12 to add the same band set to the third design section view.
  14. Press Esc to clear the previous selection. Zoom out and pan north to the sheets of section views. Click one of the section views, and then click View Group Properties on the ribbon.
  15. On the Section Views tab, click the ellipsis in the first row of the Change Band Set column.
  16. Click Import Band Set and select Section Sheets. Click OK until you have dismissed all dialog boxes and returned to the drawing. The bands have been added to the section views, but the section views must now be rearranged to account for the additional space that they occupy. You will address this in the next step.
  17. With one of the section views still selected, click Update Group Layout on the ribbon. Civil 3D automatically creates a fourth sheet as a result of this update (see Figure 11.8). This is the code that you will use.
    A fourth sheet is created to accommodate the extra area
    Figure 11.8  A fourth sheet is created to accommodate the extra area taken up by the section view bands.

Now that you have studied the display and annotation of sections, let’s take a look at the appearance of the section view that provides the backdrop for the sections. Once again, there are many similarities between section views and profile views. Both have the capability to display a grid, both can apply a vertical exaggeration, and both can use bands to provide supplemental information along the bottom or the top of the view. In fact, the only significant difference between profile views and section views is that profile views display stations (read along the alignment), whereas section views display offsets (read perpendicular to the alignment).

To change the appearance of section views by applying different styles, complete the following steps:
  1. Open the drawing named Applying Section View Styles.dwg located in the Chapter 11 class data folder. Once again, you are viewing the three design cross sections that you have been working with in previous exercises.
  2. Click the lowest section view, and then click Section View Properties on the ribbon.
  3. On the Information tab of the Section View Properties dialog box, change the style to Design 10V Major And Minor – No Padding. Click OK. One way that you might use this section view style is for close inspection and detailed editing of the section since the grid lines appear very frequently and the vertical dimensions of the sections are exaggerated even more.
  4. All That with One Style?

    When you changed the section view style from Design 5V Major And Minor to Design 10V Major And Minor – No Padding, the following changes were made to the section view:
    • The vertical exaggeration changed from 5 to 10, causing the elevation changes within the sections to be much more dramatic.
    • The elevation grid interval changed to increase the frequency of both the major grids and minor grids along with their associated labels.
    • The space beneath the sections (padding) was removed.
    • The minor interval of the offset grid lines was increased.
    This is a classic example of the power of styles. To make all of those changes manually would have taken several minutes to figure out—even for an experienced user. Instead, all you have to do is assign a different style, and all of these changes are applied instantaneously.
  5. Use the Section View Properties command to change the style to Design 1V Major And Minor – No Padding. This view is similar to the previous one but this time there is no vertical exaggeration.
  6. Use the Section View Properties command to change the style to Design 1V – No Grid. Because this section view style excludes the grid and labels, you might use it to create illustrations for a report.
  7. Use the Section View Properties command to change the style to Design 5V Major Only. This view is similar to the other views immediately above it except that the minor grids are not displayed.
  8. Press Esc to clear the previous selection. Zoom out and pan north to the three sheets of section views. Click one of the section views, and select View Group Properties on the ribbon. This opens the Section View Group Properties dialog box.
  9. On the Section Views tab, click in the Style column in the first row across from Section View Group – 1.
  10. Select Road Section Type 2 and click OK. Click OK again to dismiss the Section View Group Properties dialog box. The new section view style applies a vertical exaggeration of 2, so the section views take up more space top to bottom. In the next step, you’ll rearrange the views within the sheet so that they’re easier to read.
  11. With one of the section views still selected, click Update Group Layout on the ribbon. The sections are rearranged, and the new layout must include a fourth sheet to accommodate the extra space that is now taken up by the section views (see Figure 11.6). This is the code that you will use.
    A fourth sheet is created as a result of changing the section view style
    Figure 11.6  A fourth sheet is created as a result of changing the section view style applied to the section view group.

As you have seen, code set styles are very effective at assigning styles based on point, link, and shape codes. They can also be used to apply labels to corridor sections, and just as with styles, codes are the key to automating the placement of labels.

To apply labels to a corridor section using a code set style, follow these steps:
  1. Open the drawing named Labeling with Code Set Styles.dwg located in the Chapter 11 class data folder. Once again, the drawing is zoomed in to the design section views from the previous exercises.
  2. Click the corridor section in the bottom section view, and then select Section Properties on the ribbon.
  3. Change Object Style to Design With Labels and click OK. The corridor section now includes labels for slopes, elevations, and shape codes. Next, you will modify the code set style to add an elevation label at the crown of the road.
  4. Open the Tool Palettes window by clicking the Tool Palettes icon on the Home tab of the ribbon. Click the Basic tab of the Tool Palettes window to make the Basic palette come to the forefront.
  5. Right-click BasicLaneTransition and select Help. You will be taken directly to the Help window for this subassembly.
  6. Scroll to the bottom of the Help page, and study the coding diagram. Note that point P1 is coded Crown (see Figure 11.4). This is the code that you will use.
    Coding diagram for the BasicLaneTransition subassembly
    Figure 11.4  Coding diagram for the BasicLaneTransition subassembly.
  7. Close the Help window. Click the corridor section, and then click Section PropertiesEdit Code Set Style on the ribbon.
  8. On the Codes tab of the Code Set Style dialog box, scroll down to the Point section and locate the Crown code.
  9. Click the icon to the right of <None> in the Label Style column across from Crown. Select Crown Elev and click OK.
  10. Click OK to dismiss the Code Set Style dialog box. A marker and label are now displayed at the crown of the road. The code set style recognized the use of the Crown code within the corridor section and applied the label accordingly (see Figure 11.5).
    A code set style has been applied to the Jordan Court corridor section that includes labels
    Figure 11.5  A code set style has been applied to the Jordan Court corridor section that includes labels.