In the context of this category,
surface analysis refers to the functions that appear on the Analysis tab of the Surface Properties dialog box. Here you can perform detailed analyses relating to elevations, slopes, contours, and watersheds
(See Figure 18.5). The results of an analysis are shown graphically within the drawing and, depending on the type of analysis, can appear as shaded areas, arrows, contours lines, or even 3D areas—all color-coded for the identification of different ranges of data. In addition, you can create a legend to help convey the meaning of each color.
Tips:If the Edit Elevations panel is not visible, click Edit Elevations.
 |
| Figure 18.5 The Analysis Type choices available on the Analysis tab of the Surface Properties dialog box. |
Performing an analysis can be thought of as a two-step process. The first step is to create the analysis ranges in the Surface Properties dialog box. This step does not produce anything visible in the drawing, but it creates the data that will be used to generate graphical output. To create something visible in the drawing, you must perform the second step, which is to assign a style to the surface that displays the components of that analysis. For example, to display the slope arrows for a surface, you must first create the slope ranges and then apply a surface style which has slope arrow display turned on.
To perform a slope analysis of the design grading for the example project, follow these steps:
- Open the drawing named Analyzing Surfaces.dwg located in the Chapter 18 class data folder. This drawing contains the FG Final surface that you created in the previous exercise.
- Click one of the red or blue contours in the drawing, and then click Surface Properties on the ribbon. The Surface Properties dialog box opens.
- On the Analysis tab, select Slopes as the analysis type.
- Under Ranges, enter a value of 4 in the Number field.
- Click the Run Analysis icon (downward-pointing arrow). Four ranges are listed within the Range Details section of the dialog box.
- Edit the slope ranges as follows:
| ID | Minimum Slope | Maximum Slope | Colors |
|---|
| 1 | 0.0000% | 2.0000% | 2 |
| 2 | 2.0000% | 10.0000% | 3 |
| 3 | 10.0000% | 34.0000% | 30 |
| 4 | 34.0000% | 1158.7766% | 1 |
Tips:For ID 3, you must enter the Maximum Slope value first and then the Minimum Slope value.
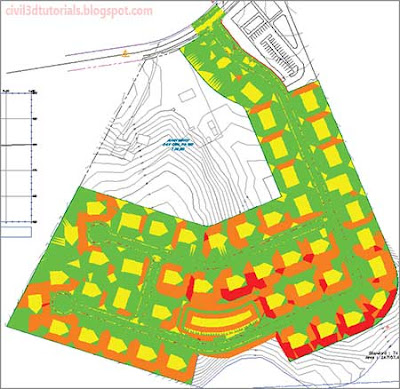
- Click the Information tab, and change the style to Slope Banding (2D). Click OK and then press Esc to clear the selection of the surface. As shown in Figure 18.6, the drawing displays colored areas indicating excessively flat slopes (0%–2%) in yellow, moderate slopes (2%–10%) in green, steep slopes (10%–34%) in orange, and excessively steep slopes (>34%) in red. The red areas are of particular concern because they represent slopes that are not stable with the type of soil found on this site.
 |
| Figure 18.6 Colored areas indicate different slope ranges within the FG Final surface. |
More about Slopes
Slopes are a significant aspect of land development design. For every project, certain slope ranges are targeted for specific purposes, and the ranges can vary from project to project. For our project, we’re interested in knowing where there are excessively flat areas (yellow, 0%–2%) because there could be potential drainage problems in these areas. Yellow areas on building pads are OK because there will be a building there, but yellow areas on the road could represent drainage problems. Green areas (2%–10%) represent slopes that can be traveled across safely by foot or with a vehicle. We would want the entire road surface to be green as well as enough area between a building pad and the street to install a driveway. Orange areas (10%–34%) represent places where traveling could not take place, but the slopes are still stable and safe from collapse. In this project, we would expect the pond embankments and the backs of some of the lots to be orange. Orange areas on the road or entire front yards that are orange would not be acceptable. Finally, red areas represent slopes that are too steep for the soil to support. These areas would be subject to collapse and considered dangerous. Red areas must be removed.
- Click one of the colored areas to select the surface, and then right-click and select Display OrderSend To Back. This allows the feature lines and other drawing graphics to be displayed on top of the colored shading rather than hidden beneath it.
- Press Esc to clear the previous selection. In the upper right viewport, click the blue rectangular feature line at the center of lot 70. On the Edit Elevations panel of the ribbon, click Raise/Lower.
Tips:If the Edit Elevations panel is not visible, click Edit Elevations.
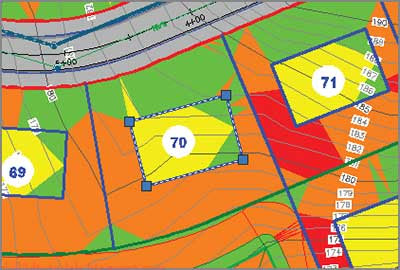
- When you are prompted on the command line to specify an elevation difference, type -5 (-1.524) and press Enter. After a pause, the surface rebuilds and the red area within lot 70 is removed. The front yard is still green, which means it is within the slope range to install a driveway (See Figure 18.7).
Tips:You may need to redo steps 2 through 6 to reestablish the ranges and colors.
 |
| Figure 18.7 Lot 70 after the building pad was adjusted downward to eliminate the steep slope |


