The TIN algorithm creates surfaces by drawing 3D lines between points that are closest to each other. In certain instances, this is not the most accurate way to model the surface, and the TIN lines must be forced into a specific arrangement.
This arrangement typically coincides with a linear feature such as a curb, top of an embankment, or wall. This forced alignment of TIN lines along a linear feature is best handled with a breakline. In
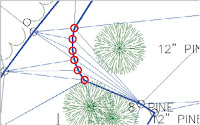
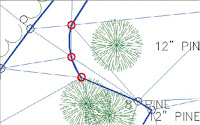
Figure 1, the blue lines represent the edges of a channel and the TIN lines are shown in red. In the image on the top, the blue lines have not been added to the channel surface as breaklines, resulting in a rough and inaccurate representation of the channel. In the image on the bottom, the breaklines have been applied and force the TIN lines to align with the edges of the channel, producing a much smoother and more accurate model.
 |
 |
| Figure 1: The effect of breaklines on a surface. |
From Prospector, you can add breaklines by right-clicking the
Breaklines node for a given surface and selecting
Add -
(see Figure 2).
 |
| Figure 2: Adding breaklines from within Prospector. |
When it comes to survey data, there is an even easier way. From the Survey Toolspace, you can right-click
Figures and select
Create Breaklines. This will open a list of all of your survey figures with some checked as breaklines and some not -
(see Figure 3). How does it know which is which? It was specified in the figure prefix database that you learned about in
Establishing Existing Conditions Using Survey Data. As the figures were created, they were automatically tagged as breaklines or non-breaklines according to the code assigned to the points that define them.
 |
Figure 3: Creating breaklines from survey figures.
Note how some figures are checked as breaklines and some are not. |
To add breaklines to a surface and observe their effect on the accuracy of the surface, follow these steps:
- Open the drawing named Add Breaklines.dwg or (Add Breaklines.dwg (METRIC)) located in the Exercise_04 class data folder.
- On the Survey tab of the Toolspace, right-click Survey Databases and select Set Working Folder.
- Browse to and select the Exercise_04 class data folder. Click OK. You should see a different survey database named Essentials.
- Right-click the Essentials survey database, and select Open for edit.
- Expand the Essentials database. Right-click Figures, and select Create Breaklines.
- Scan the list of figures, and note which ones are tagged as breaklines. Click OK.
Breaklines in the Field
As you study the list of figures in this exercise, are you wondering why some are designated as breaklines and others are not? Breaklines are linear features that mark a change in the slope of the ground. Some of these are quite obvious, such as a set of bottom of bank (BOB) points and top of ditch (TOPD) points. Others serve double duty, such as an edge of pavement (EP). This survey figure marks the line where pavement ends and dirt begins, but typically there is also a change in slope at this line between the slope of the ground and the man-made slope of the road. For this reason, EPs are often tagged as breaklines. Other features obviously have nothing to do with the slope of the ground, such as a right of way (ROW), treeline (TL), and fence line (FENC); therefore, they are not checked as breaklines.
- In the Add Breaklines dialog box, change the Mid-ordinate Distance value to 0.1 and click OK. (See the sidebar “Breakline Settings and Options” for more information.) You should notice a change in the contours along the red breaklines. These breaklines define the swales, edges, and ridges that were recognized in the field and explicitly located as terrain features. In addition, notice that contours now cover the road area to the north. The surface in this area is made strictly of breaklines.
- In the top right viewport, click one of the surface contours, and then click Surface Properties on the ribbon.
- On the Information tab of the Surface Properties dialog box, change the Surface style to Triangles. Click OK. Notice how TIN lines do not cross the breaklines.
- Open Surface Properties once again. On the Definition tab, uncheck the box next to Add Breakline, as shown in Figure 4. Click OK and then click Rebuild The Surface. You have removed the effect of the breaklines temporarily. Notice how the TIN lines cross back and forth over the swale and ridge lines, creating a rough edge where there should be a sharp, well-defined edge.
 |
| Figure 4: Unchecking the Add Breakline operation for the surface. |
This exercise shows you the importance of breaklines. Connecting a bunch of points together with 3D triangular shapes does not necessarily generate an accurate surface. In certain areas, the shapes themselves have to be manipulated so that they align with terrain features in order to model their form accurately.
Figure 5 compares the surface with and without breaklines in both 2D and 3D views.
 |
| Figure 5: The two top views show the surface in 2D and 3D without the breaklines; the two bottom views show the surface with the breaklines included. |
Breakline Settings and Options
The
Add Breaklines dialog box has several options and values to choose from. Here is a brief explanation of each:
- Type
- Of the five types listed here, only two are important to discuss at this time: proximity and standard.
Standard breaklines have two jobs. First, they control the alignment of TIN lines, as discussed previously. Second, their vertices are a source of additional point information in the drawing. As you might recall, the only point group you added to the surface is Ground Shots, so you’ll need the points to come along with any breaklines that you add. For this to work, the vertices of the breaklines must be 3D and must be at the correct elevations.
Proximity breaklines have only one job, which is to control the alignment of TIN lines. Therefore, proximity breaklines only need to be 2D, but they must have points in their proximity so that they can “steal” their elevations. If you had added all of the survey points to your surface, then the survey figures could have been added as proximity breaklines. - Weeding Factors
- Sometimes, the items you use for breaklines can have too many vertices on them, and you’ll want to eliminate some of them so that your surface isn’t overloaded with data. The selective removal of points based on distance and angle is known as weeding.
- Supplementing By Distance
- Sometimes your breaklines will have long stretches without any vertices in them. Since new TIN lines are created only where there are points, and points are created only where there are vertices, some supplemental vertices may be needed to improve the accuracy of the surface. When you check the box next to Distance, Civil 3D will create more points along the breakline that are spaced out according to the value you provide.
- Supplementing By Mid-Ordinate
- Curves are a bit of a challenge because TIN lines are straight and curves are, well, curved. For that reason, any curves in a breakline are approximated with a series of short TIN lines. Just how short and numerous these lines are depends on the mid-ordinate setting. Mid-ordinate is a geometric term that refers to the perpendicular distance between an arc and its chord. When this distance is short, the chord is also short and multiple instances of it can fit within the length of the arc. This might seem like a strange way to define this behavior, but what’s handy about it is that a single mid-ordinate value works pretty well for a fairly wide range of curve radii. The following image shows the effect of the mid-ordinate setting on a surface. The image on the uses a value of 0.1, and the image on the right uses a value of 1.0.
 |  |


