 You’ve seen some of the power of dynamic point editing; now let’s look at how those dynamic edits can be used to your advantage in point tables.
Most commonly, you may need to create a point table for survey or stakeout data; it could be as simple as a list of point numbers, northing, easting, and elevation. These types of tables are easy to create using the standard point-table styles as a beginning reference. Follow these steps to create a point table:
- Open the 0308_PointTable.dwg or (0308_PointTable_METRIC.dwg) file.This file will appear empty, but it isn’t. First, you will review reordering point group properties to change the display of points. You don’t need to see points to make a point table from a group, but this will help you see that the table reflects the specific group.
- In Prospector, expand Point Groups.You will see that No Display is listed on the top, which means the styles set in its properties are taking over the other point groups.
- Right-click Point Groups and select Properties.
- In the listing, move the group Corners To Locate to the top by using the arrows on the right. Click OK.
- Right-click the Corners To Locate point group and select the Zoom To option to focus on the desired points.
- Switch to the Annotate ribbon tab and click Add Tables ➢ Add Point Table.
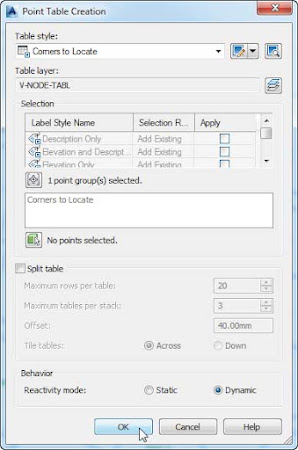
- Verify that Table Style is set to Corner To Locate and click the Select Point Group icon next to the No Point Groups Selected label.
- In the Point Groups dialog, select Corners To Locate and click OK.
- Verify that the check box next to Split Table is clear.
- When all your settings match those in Figure 1, click OK.

Figure 1: Point Table Creation options. - Click anywhere in the graphic to place the table.
- Save the drawing.

