AutoCAD Civil 3D provides many tools for relating surveyed information to a graphic. Best-fit tools like the ones in the following sections perform analysis on different types of irregular geometry to create uniform shapes (see
Figure 1).
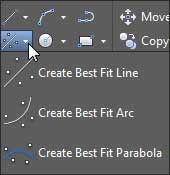 |
| Figure 1: The Create Best Fit menu options |
Creating a Best-Fit Line

The Create Best Fit Line command under the Best Fit drop-down on the Draw panel takes a series of Civil 3D points, AutoCAD points, entities, or drawing locations and draws a single best-fit line segment on the selected input. In
Figure 2, the Create Best Fit Line command draws a best-fit line through a series of points that aren’t quite collinear. The best-fit line will adjust as more points are selected.
 |
| Figure 2: A preview line drawn through points that are not collinear |
After you press Enter to complete the selection, a Panorama window appears with a regression data chart showing information about each point in the selection, as shown in
Figure 3.
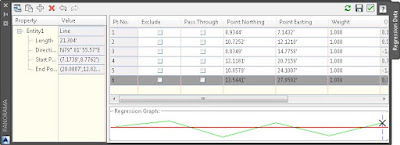 |
| Figure 3: The Panorama window lets you optimize your best fit |
This interface allows you to optimize your best-fit element by adding more points, excluding points, selecting the check box in the Pass Through column to force one of your points on the line, or adjusting the value under the Weight column based on how important each point position should be in the definition of the element relative to the other points.
Creating a Best-Fit Arc

The Create Best Fit Arc command on the Best Fit drop-down works the same as the Create Best Fit Line command, including the Panorama adjustment window, except that the resulting entity is a single arc segment as opposed to a single line segment (see
Figure 4).
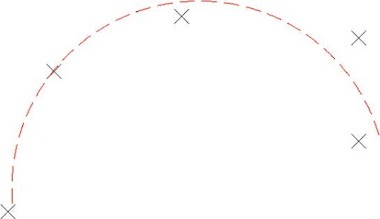 |
| Figure 4: Preview of the curve created by best fit |
Creating a Best-Fit Parabola

The Create Best Fit Parabola command on the Best Fit drop-down is similar to the line and arc commands in how it works. After you select this command, the Parabola By Best Fit dialog appears (see
Figure 5).
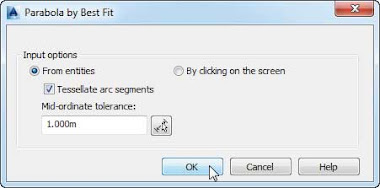 |
| Figure 5: The Parabola By Best Fit dialog |
You can select inputs from entities (such as lines, arcs, polylines, or profile objects) or by clicking onscreen. The command then draws a best-fit parabola on the basis of this information. In
Figure 6, the shots were represented by AutoCAD points; more points were added by selecting the By Clicking On The Screen option and using the Node Osnap to pick each point.
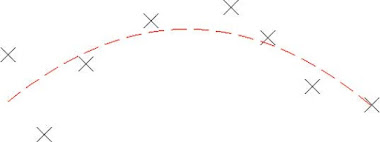 |
| Figure 6: The best-fit preview line updates as more points are picked |
Once you’ve selected your points, a Panorama window (shown in
Figure 7) appears, showing information about each point you chose. Also note the information in the left pane regarding the K value, curve length, grades, and so forth. You can optimize your K value, length, and other values by adding more points, selecting one or more check boxes in the Pass Through column to force one of your points on the line, or adjusting the values in the Weight column.
 |
| Figure 7: The Panorama window lets you make adjustments to your best-fit parabola |

 The Create Best Fit Line command under the Best Fit drop-down on the Draw panel takes a series of Civil 3D points, AutoCAD points, entities, or drawing locations and draws a single best-fit line segment on the selected input. In Figure 2, the Create Best Fit Line command draws a best-fit line through a series of points that aren’t quite collinear. The best-fit line will adjust as more points are selected.

 The Create Best Fit Arc command on the Best Fit drop-down works the same as the Create Best Fit Line command, including the Panorama adjustment window, except that the resulting entity is a single arc segment as opposed to a single line segment (see Figure 4).
 The Create Best Fit Parabola command on the Best Fit drop-down is similar to the line and arc commands in how it works. After you select this command, the Parabola By Best Fit dialog appears (see Figure 5).


