Mistakes in the field can also lead to errors in the way linework is drawn. Once again, the changes need to be made a certain way because you are dealing with special survey objects, this time survey figures. Survey figures are linked to the survey database. Unlike survey points, they can be edited without accessing the survey database. However, at that point in time, they are no longer in sync with the survey database. It is important to use the correct commands and keep your edits in sync with the survey database to ensure that the correct data is utilized in the future.
- Open the drawing named Edit Survey Figures.dwg or (Edit Survey Figures.dwg (METRIC)) located in the Exercise_03 class data folder.
- If the contents beneath the Essentials 5 survey database are not visible, right-click Essentials 5 and select Open for edit.
Tips :The Essentials 5 database is the result of correctly completing the previous exercise. This database is provided to ensure that you start the current exercise with the correct version.
- In the top-right viewport, locate the building that is missing its north side. Click the building figure line, and then click Survey Figure Properties on the ribbon. Notice that point 285 is missing a CLS (close) code that would provide the north side of the building by closing the rectangle.
- Click point 285 in the point list; then set the Closed value to Yes and click OK. The shape of the building is now closed. Because you used the Survey Figure Properties command to edit this figure, the drawing and the survey database are in sync.
Tips :At this point, you could back out and fix the point description. However, for the purposes of this exercise, you’ll edit the figure instead.
- Press Esc to clear the previous selection. Pan to the southeast until you can see the building to the west of the 6" (150mm) pine. This building should appear as two separate buildings. Click the building figure, and then click Survey Figure Properties on the ribbon.
- In the Figure Properties dialog box, click point 88 and then click the red X icon. Remove points 289, 290, and 291 in the same manner.
- Click OK to close the Figure Properties dialog box. Now only the north building is shown in the drawing.
- Right-click Figures on the Survey tab, and select Create Figure Interactively.
- When prompted, enter BLD2 as the figure name and click OK.
- Click the four points that make up the smaller building, and then press Enter.
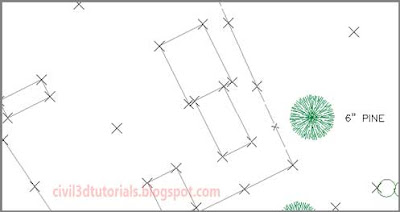
- In the Figure Properties dialog box, set the Closed value to Yes. If necessary, adjust the order of the points using the arrow buttons. Click OK when the blue figure outline appears as a rectangle in the drawing. The building figure now appears as it should, and the two separate buildings are represented properly, as shown in Figure.
 |
| The result of editing the building figures. |
 Mistakes in the field can also lead to errors in the way linework is drawn. Once again, the changes need to be made a certain way because you are dealing with special survey objects, this time survey figures. Survey figures are linked to the survey database. Unlike survey points, they can be edited without accessing the survey database. However, at that point in time, they are no longer in sync with the survey database. It is important to use the correct commands and keep your edits in sync with the survey database to ensure that the correct data is utilized in the future.


